Hotels Revenue Dashboard in Power BI
Skills: SQL Server, Power Query, DAX, Power BI
Objective: The main goal of this project is three-fold - to deal with a different type of dataset, further developing the skills of the first project and also focusing on the Data Analysis Expressions (DAX), constructing measures and calculated columns to consolidate the acquired knowledge with this language. The following points served as a guide to the development of the project:
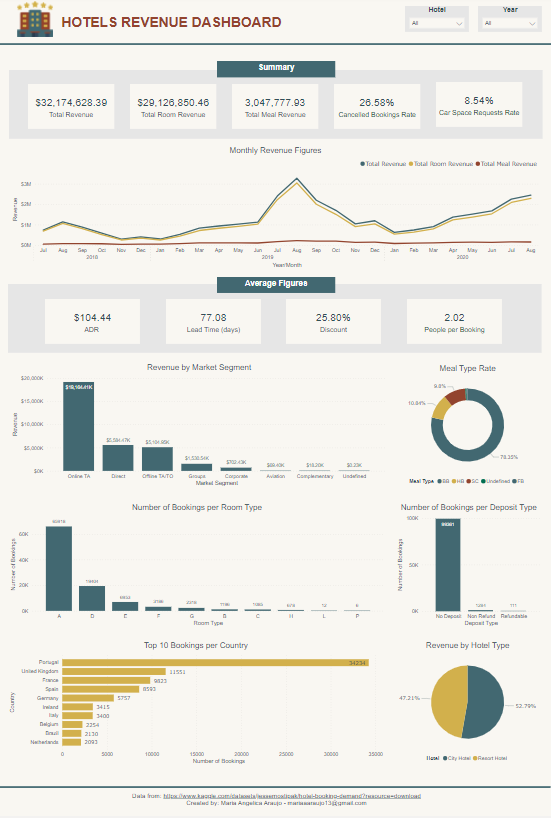
Summarize the booking figures showing: the total revenue, total room revenue, total meal revenue, canceled bookings rate and car space requested rate.
In a line chart, show the revenue figures (total revenue, total room revenue and total meal revenue) monthly;
Summarize the following average figures: ADR, lead time, discount and number of people per booking. For details about the meaning of these figures refer to the documentation on GitHub;
In different bar charts, show: 1) the revenue by market segment, 2) the number of bookings per room type, and 3) the number of bookings per deposit type;
Using a donut chart, illustrate the percentage of the meal type and in a pie graph, show the revenue by hotel type (city and resort hotel);
In a stacked bar graph, show the top 10 countries with the highest number of bookings.
All this information should be filtered by the type of hotel and year. The only exception is the pie chart which should be filtered only by the year and not by the hotel type.
Data source: This dataset shows booking information of two Hotels, the city hotel and the resort hotel, between the years 2018 and 2020. It can be found on https://www.kaggle.com/datasets/jessemostipak/hotel-booking-demand?resource=download
Development of the project: I used SQL to analyze the data and to add together all the booking information for the three years into one unique table.
Then, I imported the tables into Power BI (PBI) using the advanced options and SQL statement.
The ETL process was done via Power Query and after that, I was able to create a star schema model for this project. The schema had one fact table and four dimension tables, where one of them was a date table.
With all the data organized and ready to be explored, I created some calculated columns and measures in order to answer the questions about the revenue of these hotels.
Finally, the visuals were created in line with the questions raised, and the main insights were highlighted.
The dashboard and SQL file can be found here: https://github.com/ds-mariaraujo/HotelsRevenueProject.git
Below you can see the layout of the Hotels Revenue Dashboard:


